

Detecting Knee Valgus (inwards collapse) with Biomechanics
Tonal has expanded our computer vision system to detect and highlight when a member's knees are buckling inwards

Written By Steven Hirsch, PhD
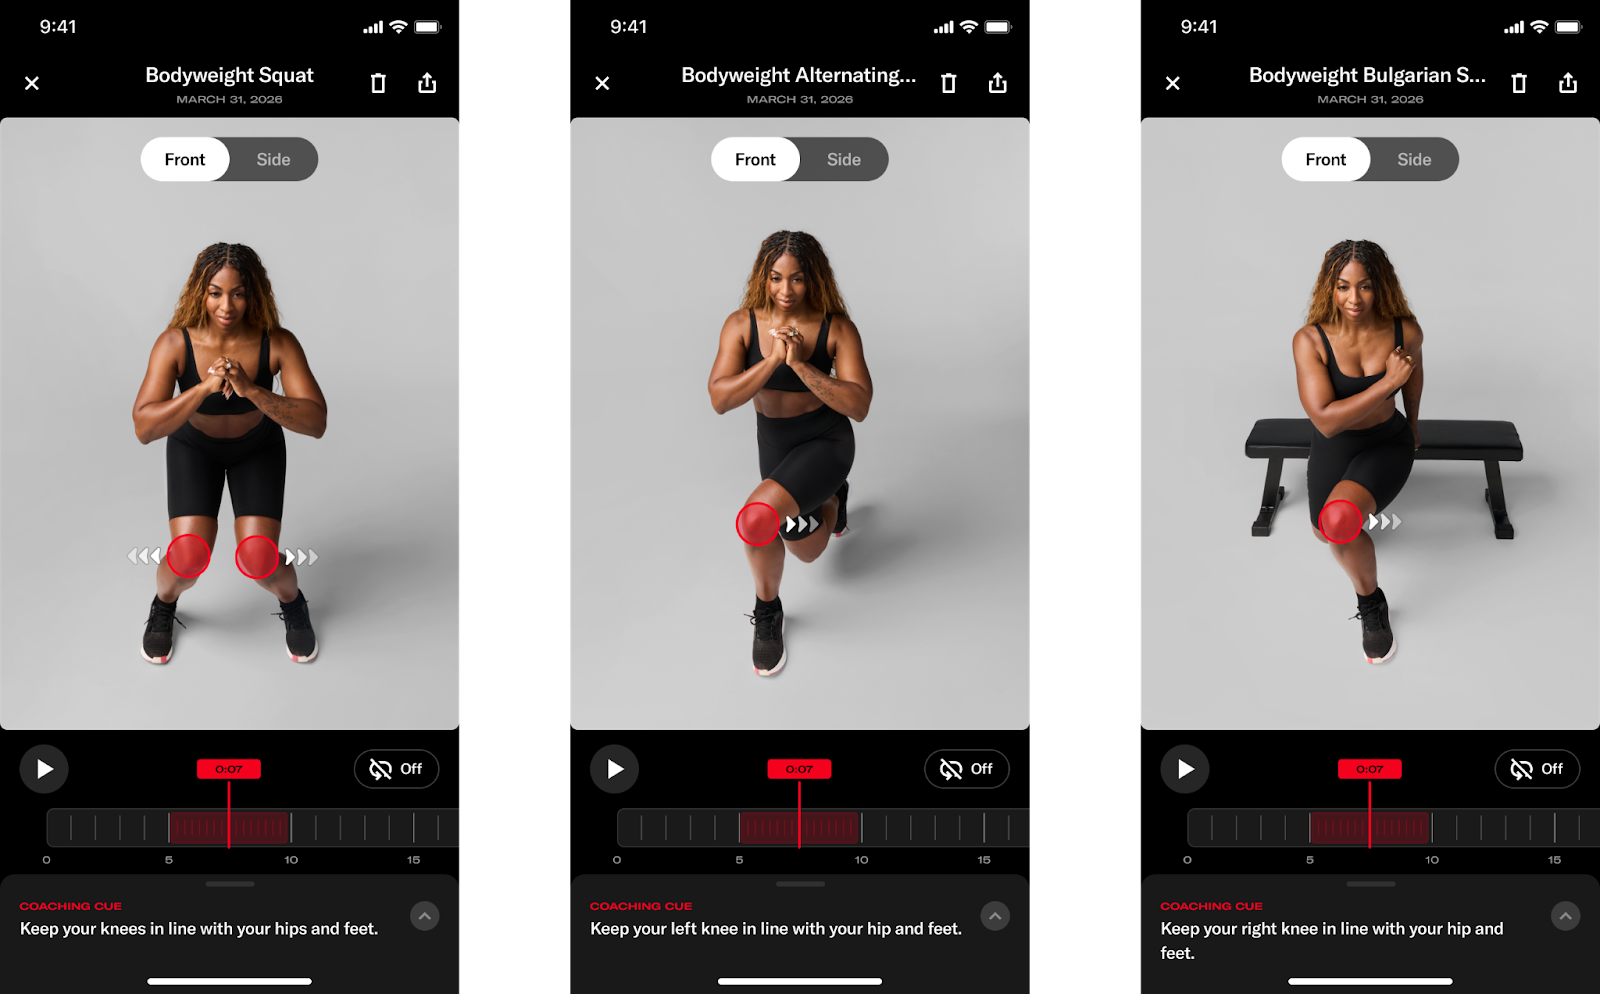
We have launched a brand new addition to Smart View which enhances our coaching experience beyond what you see on the trainer. Tonal has always provided real-time feedback to guide users to keep them safe while exercising, and we previously added marker visualizations to our post-workout coaching experience to dive even deeper into exercise technique. Now, we’ve added both brand-new coaching cues to monitor risky knee motion, and new visualizations for highlighting motions that may increase the risk of injury during squatting and lunging exercises.
In this blog, we’ll explore why we wanted to build coaching and visualizations around these movements, as well as how we built this functionality.
Why Monitor Knee Motion and What Makes that Difficult?
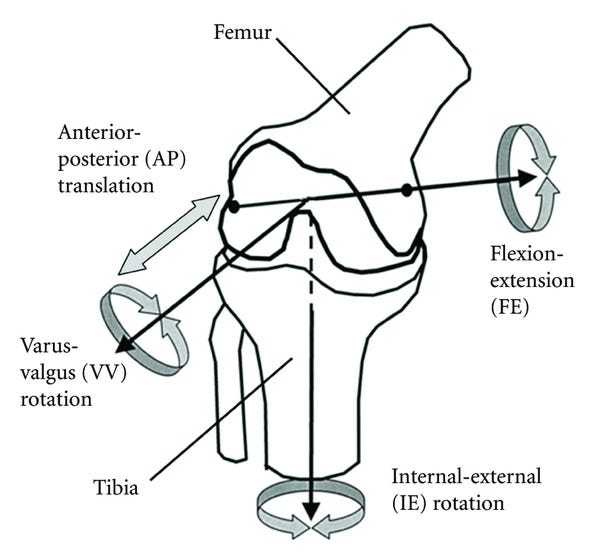
The movement strategy we have built new coaching cues for, and are expanding our post-workout visualization tool with, is known as dynamic knee valgus, or the knee abduction angle. Conceptually, dynamic knee valgus is when your knee “collapses” towards your midline. In 3D biomechanical analyses, we often refer to this motion as a knee abduction angle, which can be computed via the Grood and Suntay Joint Coordinate System Definition (Grood and Suntay, 1983) whereby the “knee abduction” axis is a floating axis between the mediolateral axis of the femur and the vertical axis of the tibia.
Why does Knee Valgus Matter?
Let’s take a look at two critical questions: why monitor knee valgus and what makes it such a difficult problem?
For the first part of this question, there’s quite a bit of research, both in-vitro (i.e., doing tissue biomechanics work on cadavers) and in-vivo (i.e., in living people), suggesting that this general joint motion results in excessive loading of passive structures (ligaments and tendons) around the knee joint complex (Petersen et al., 2014). It has also been shown to prospectively identify those with an increased risk of injury when excessive medial knee motion is observed in a movement assessment (e.g., Hewett et al., 2005. The story here is more complex though and requires its own deep dive!), and is commonly recorded retrospectively during landing events that resulted in ACL injuries (e.g. Koga et al., 2010).
Although this sounds scary, it’s incredibly unlikely that you would sustain one of these injuries while exercising. However, what we do know is that how you move during your exercise directly impacts how you move beyond the exercise environment as well. In fact, there’s direct evidence that those who focus on their movement quality during exercise get just as fit as those who focus on fitness alone, but also move in less risky ways during high-demand transfer tasks where we would be more worried about someone sustaining those injuries (Frost et al., 2015). In other words, how you move during exercise matters a lot for your general health beyond just the gym, so we want to make sure that all Tonal members move well both on and off our machines.
What makes measuring knee valgus so difficult? The motion itself is a 3D motion that we’re capturing with a single 2D camera. So, we’re already working from a bit of a disadvantage. In addition to using more sophisticated pose detection models, there’s a lot of post-processing that we do with biomechanical models and digital filtering algorithms that helped bring this coaching cue feature for this important motion to life. Let’s dive deeper into some of the technical underpinnings to make this happen.
How we Built It
There’s a few standard pieces of technology for many markerless motion capture systems that we implemented to build out this feature. Our goal isn’t to do a deep-dive into each, but a general overview of how we were able to build a robust system for our users. At a very high-level, we compute the motions of interest, and highlight them to our users, with the following general architecture:
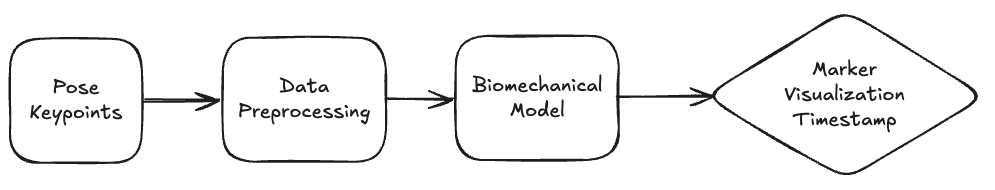
Pose Keypoints
During this phase, we run our computer vision model in real-time to generate pose detections for key body landmarks in 2D and “lift” into 3D. We’ve worked with our partner, ASENSEI, on generating these pose detections (in real-time) that begin our processing pipeline.
Data Preprocessing
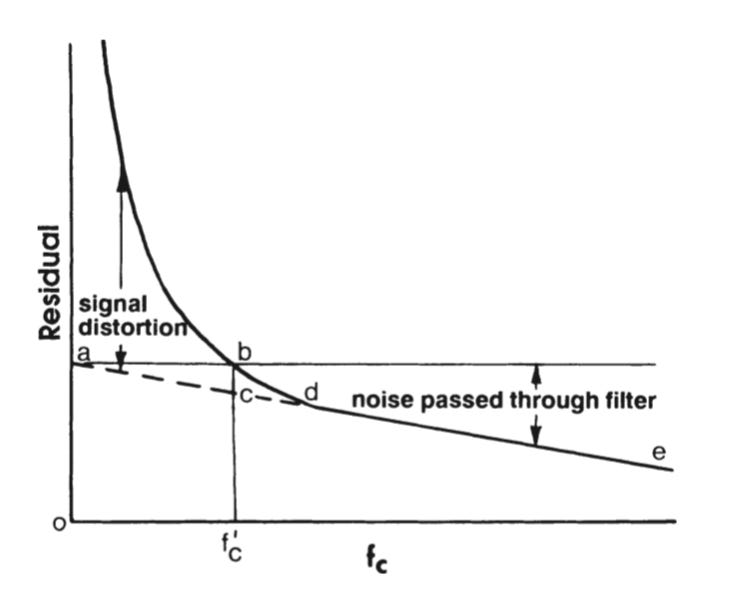
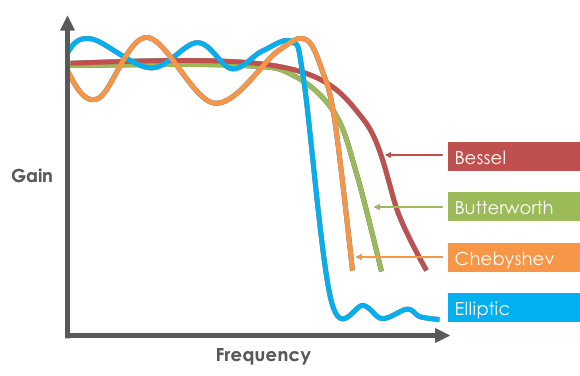
After obtaining the pose coordinates, we kick off a data preprocessing stage where we do some cleaning of this “raw” data. Firstly, it’s not uncommon for unilateral exercises to experience limb swapping on some key frames of data, which is when the pose model is uncertain about the body’s left and right sides. We’ve adopted a modified version of the algorithm presented in Zecha et al., (2018) to catch and correct for these rare instances. Then, we do some standard low-pass digital filtering to smooth our keypoint data to ensure the various features and event detection algorithms we use downstream work as expected. For example, data with high-frequency noise makes it challenging to determine a single peak, and high-frequency noise gets amplified when calculating the slope of a signal. Smoothing the data helps with our event detection algorithms and ensures that high-frequency noise in the raw pose detections don’t get amplified for any finite differences we may compute downstream. We used a 4th order, low-pass zero-lag Butterworth filter to smooth our data. To implement this filter, we specify a cutoff frequency where any frequency components of a signal “above” that threshold get attenuated/eliminated. To determine this cutoff frequency, we performed a residual analysis outlined by Winter (2009), as well as reviewed Power Spectral Density plots to get a qualitative interpretation of the frequencies in our data. For the residual analysis specifically, we set a range of potential candidate cutoff frequencies, “sweep” through all the candidates by applying a filter with each potential cutoff frequency, and then compute the root mean squared error between the original and the (candidate) filtered signal. We intentionally selected frequencies that are very low and high (but not exceeding the Nyquist frequency) so that we had a nice range of potential cutoff frequencies to evaluate. Then, a “final” cutoff frequency is selected that balances signal distortion with noise passthrough. That cutoff point is typically where the “elbow” in the residual plot occurs.
When filtering the data, it’s critical we use a dual-pass filter to introduce zero phase-lag. Typically, digital filters will introduce some “lag” into a signal since they are computed with convolutions from previous samples to calculate the current output. This lag would then negatively impact the timestamps we wish to annotate in our post-workout summary screen. The “dual-pass” part of the filter means that we apply the filter first in the “forwards” direction, and then again in the “backwards” direction, to “cancel out” the phase lag that we introduce by only using the filter in a single direction. Butterworth filters are common in many biomechanics applications given their (relatively) smooth passband and steep roll-off.
Biomechanical Model
After doing the post processing with our raw data, we then use those new keypoints as inputs into our biomechanical model, which computes joint angles throughout the entire body. A biomechanical model is our mathematical model that translates body keypoints into anatomically meaningful joint angles (e.g., rather than reporting joint motions as quaternions, for example, we usually define angles in a simpler-to-interpret manner for a human). We then use those joint angles as features into the next stage of our pipeline. We create local coordinate systems for each segment, and then express joint angles as rotation matrices between adjacent segments. Then, those matrices are decomposed into Cardan/Euler angles based on ISB recommendations (Wu et al., 2002). Specific to the knee joint of interest, we use an XYZ rotation sequence that is equivalent to the joint coordinate system outlined above. However, there are other 2D and 3D features that one can use to compute this knee valgus motion, such as the orthogonal distance of the knee joint center from the hip-foot plane (see Thesis from 2023) as well as measures of how much the knee is medially deviating in 2D. A combination of these anatomically meaningful metrics (as opposed to quaternions which are often used to unambiguously define joint rotations but provide a more challenging clinical interpretation) can then be used to discern the timestamps to identify moments during the repetition where we want to provide feedback on how we recommend the user should be moving differently.
Why This Matters
Building a robust pipeline to detect this movement feature and provide this coaching cue delivers on our promise at Tonal to keep our members safe and ensure their workouts are as effective as possible. Specifically, the new models and processing pipelines will be the critical foundation for future intelligence-related features that we aim to launch under the smart view umbrella. So, this current work not only helps us deliver value to our users today, but gives us the opportunity to provide even more value in the coming months as we launch more features to make our workouts safer and more effective!
Tonal just added real-time knee valgus detection to their coaching experience and the reasoning behind it is worth paying attention to.
Knee valgus during squats and lunges is one of those patterns that sneaks up on you, and you don't always feel it happening, especially under load. Having a system flag it in the moment and visualize it post-workout closes a feedback loop most people never get outside of working with a good coach.
The fact that they're pulling this off with a single camera and no wearables makes it genuinely impressive. Smart move and another reason to upgrade to Tonal 2.