

Predicting Reps in Reserve with Machine Learning
How close are you to failure, and why does it matter for strength training?

Written By Steven Hirsch
Work by Steven Hirsch, Josh Shapiro, Jacob Rauch, and Giuseppe Barbalinardo
Originally presented at the 3DAHM 2024 International Symposium in Montevideo, Uruguay
What If Your Gym Knew When You Were About to Fail a Rep?
Imagine you’re midway through a heavy bench press set. You’re starting to struggle more and more each rep and your muscles are starting to burn as you approach muscular failure. You remember Arnold Schwarzenegger’s quote to keep you going:
"The last three or four reps is what makes the muscle grow. This area of pain divides the champion from someone else."
As it turns out, there’s quite a bit of research supporting Arnold’s old quote that training close to failure is imperative for maximizing muscle growth (Zourdos et al., 2024, Grgic et al., 2022). Some critical insights include:
Training closer to failure is important for muscle growth
It ramps up recovery time
Consistently training to failure may result in compromised technique that increases injury risk. Therefore, knowing how many repetitions you have left in the tank before you reach muscular failure is important for reaching your goals in a safe manner.
The number of how many repetitions you have left in the tank is called Repetitions in Reserve (RIR). The sweet spot of just how many repetitions you have in reserve at any given time depends on the person, their goals, the exercise being performed, and various other factors such as fatigue levels and general exercise competency.
Usually, RIR is perceived/estimated by the trainee while they are exercising. This works quite well for advanced trainees or experienced coaches watching their athletes. In this blog, we’ll walk through how we’re teaching Tonal to estimate RIR for all of our users, including beginners, without relying on a live coach or a user’s gut feel.
We set out to estimate RIR accurately, at scale, for a diverse set of users, using high-frequency sensor data, thoughtful biomechanics, and machine learning. The result? A model that beats the literature-standard approach by nearly 2x and makes our product even more effective and safe for our users.
Why RIR is Hard to Estimate
In research settings, human raters can estimate RIR with about ±1 rep of error. In other words, people can usually guess to within one rep of when they’re going to fail. A critical point here is “in research settings”. In the lab, people are told before the set starts to track the number of reps they think they have in reserve throughout the set. They are also often asked mid-set how many repetitions they think they may have left in the tank before reaching failure (which can also create a “self-fulfilling prophecy” that is not always accounted for in these studies). In cases where studies monitor movement velocity to estimate RIR, the trainee is cued to use maximum effort and move as fast as possible during every repetition to try to produce a monotonically decreasing movement velocity throughout the set as the person fatigues. This constrained behaviour can help reduce any rep-to-rep noise that may negatively impact RIR estimates.
But in real-world training? It’s noisy. People vary in their effort, pacing, and movement strategies much more than in a controlled lab setting. It’s also much easier to push someone in a lab setting to absolute failure by providing more motivation. In real-life settings, not everyone has a friend or coach there to amp them up at the end of every set.
Most RIR models in the exercise science literature use a simple approach: predict RIR based on the drop in concentric velocity across a set (since they can assume a monotonic decrease in velocity given how they’ve cued their participants). But this method breaks down when users don't exert maximal effort, or when their velocity patterns aren’t smooth or linear (spoiler: most aren't).
Let’s take a look at some example data from Tonal. The three images below are the first, third, and fifth rep of a trainee’s bench press. The X-axis is time, and the y-axis shows their velocity.


With this real world data, we don’t see the consistent velocity loss after each rep like we might in a lab setting. For example, rep 3 has a faster average velocity than rep 1. What is already a challenging task in the laboratory is made even more difficult by the realities of how people move in the real world. But, in order to make a model capable of accurately predicting Reps in Reserve in the wild, these are exactly the challenges we needed to solve.
Building the Dataset: 56,000+ Reps of Real-World Effort
To build and evaluate our model, we pulled 56,025 bench press repetitions from 4,482 anonymous Tonal users, sampling position and velocity data at 50hz during regular training sessions (not controlled lab conditions). To ensure high data quality, we filtered sets and data based on the following conditions:
Only users with ≥50 completed bench press sets were included in our analysis.
Spotter mode had to be triggered. The idea here is to find sets where users are struggling. Although this is not the same as verifying people cannot lift another repetition like in a lab setting, our spotter model only kicks-in when it is clear someone cannot complete the repetition anymore, whereby we lower the weight considerably so that the person is still safe.
Once spotter was engaged, the user continued to require spotter for every rep thereafter. Here, we’re eliminating users who maybe needed a temporary bit of help but who have not actually hit failure.
The load a person was lifting had to be within 20% of the trainer’s prescribed weight. We did this because we didn’t want to include any sets where a user may have lifted a load much higher or lower than what we would have expected them to after already calibrating to their strength with at least 50 sets of bench presses.
At least half of the prescribed set had to be completed without spotter assistance. This again ensured that we didn’t include any sets where the load selected for the person was out of the ordinary.
This gave us a training set of 50,767 reps, and a holdout test set of 5,639 reps to evaluate our model. Below is a histogram of the number of reps users performed per set before failing:
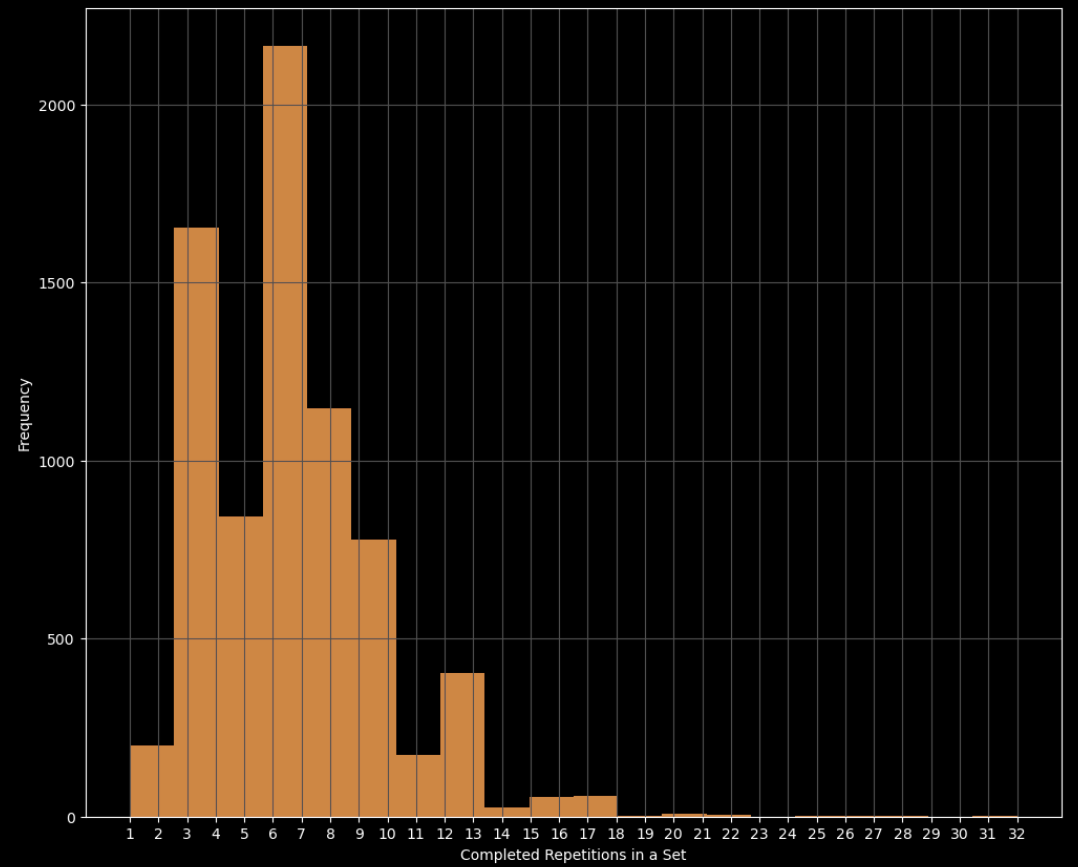
Using this rep-level data, we asked our model to predict ‘based on data from this single rep, how many more reps will the user perform before failure?’.
From Raw Data to Smart Features: Moving Beyond Velocity Loss
The Problem with Velocity Loss Alone
Most models in the research literature only evaluate mean velocity loss during a set to estimate RIR. Although velocity loss may be suitable in lab scenarios where we can ensure someone is lifting with maximum intent every repetition, this is not a realistic situation in the real world. As seen in Figure 1 above, mean concentric velocity does not always monotonically decrease during exercise sets. People may slow down or speed up at the start of their sets depending on how they feel that day and how many reps they are planning to perform. Very few people will move as fast as possible during the first few reps of a 12-rep set unless they are specifically instructed to do so.
Our Approach: Richer Feature Engineering
Instead of just looking at average velocity, we also looked at:
Velocity waveform shape features
Using PCA on normalized velocity curves, we extracted waveform shape features. Inspecting the data revealed clear changes in the velocity waveforms that occurred independently of the velocity attained, which could be representative of fatigue levels, and thus RIR.
Rate of force development (RFD)
Rate of force development is a metric that captures how quickly a trainee develops force.
We examined a variety of RFD metrics including peak force, timing, and intervals up to 400ms.
Kinetic data could provide more information about the force-producing capacity that a person still has. This is still impacted by how much effort someone is putting forth, but we theorized that people may maintain a higher RFD earlier in a set when they are less fatigued even when “coasting” through the rest of the repetition.
Speed and force ratios between concentric and eccentric phases
Additional information about how people are controlling the barbell on the way down (i.e., during the eccentric phase) could be informative of their general fatigue levels.
Set-level context (prescribed reps/the %1RM they were lifting)
Additional metadata can give the sets, and the reps within those sets, more context.
These helped the model detect subtle cues of fatigue and struggle not captured by velocity loss alone to provide a more accurate RIR estimate.
Model Showdown: How Our LightGBM Model Stacked Up
In addition to the additional feature engineering we performed, we also wanted to expand on the previous methodology in the exercise science literature and use other more advanced model architectures. Therefore, rather than using only a simple linear regression model based on velocity loss, we used a gradient boosted tree (LightGBM), along with our new features, to see if we could improve upon traditional RIR estimates. We also included a point of comparison in our analysis, a basic model (“The Prescribed Reps Model”) which estimated a trainee’s RIR based on the percentage their estimated one repetition maximum (1RM) they were lifting. For example, if someone is lifting 80% of their 1RM, we would expect them to perform somewhere ~8-12 repetitions before reaching failure depending on their training experience, sex, and muscle fiber composition. So in this model, after rep 1 we may expect 9 RIR, after rep 2 we would expect 8 RIR, and so on. The main limitations of this basic model are that 1) we are estimating a user’s 1RM and not directly measuring it, 2) it doesn’t use any live performance data, and 3) a users’s 1RM can fluctuate between days and this model does not capture those fluctuations.
Having recognized these limitations, the Prescribed Reps model still provided a good target baseline that we aimed to beat with our more complex approach.
To evaluate the accuracy of the LightGBM, Velocity Loss, and Prescribed Reps models, we looked at two mesures: the overall mean absolute error (MAE) across all reps in our dataset, as well as the MAE when the trainees were at fewer than 5 RIR since.
The idea behind looking specificly at ≤ 5 RIR is motivated by two things. First, most RIR models perform better the closer someone is to failure, we so wanted to focus on this more competive slice of data. Secondly, we wanted to see how effective the models were able to identify what we called effective repetitions (i.e. Arnold’s point about the last few reps being the most effecitive). If we can sucessfully flag effictive reps, this gives us insight into both how close someone is to failure as well having a measure of how effective their overall workout is. By counting the number of effective reps someone accrues during training, we can evaluate if they are making good progress towards their muscle growth goals (as we would want to ensure on Tonal that people with muscle growth goals are accumulating many reps close to failure). While this metric may sacrifice some resolution for use-cases such as predicting when someone is going to fail, it may be effective enough for identifying training stimuli for monitoring progress and understanding how much time someone may need to recover from their workout. To assess the accuracy of each model’s ability to identify effective reps, we also computed the precision, recall, and F1 score of each model.
After building each model using the training data, we then compared the three approaches on the holdout test set.
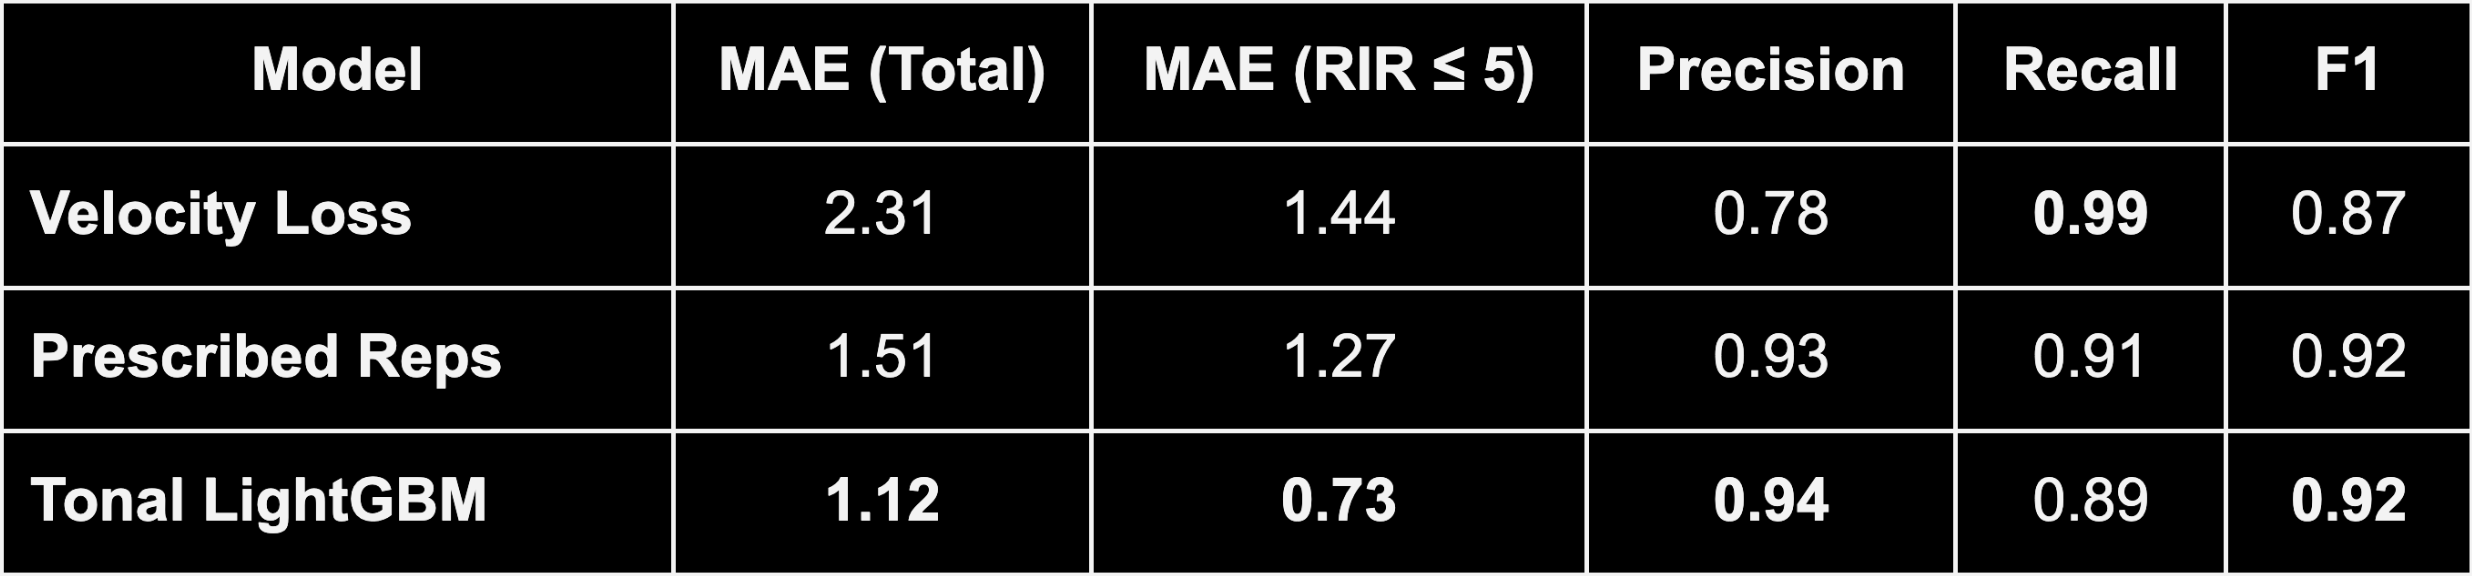
Tonal’s LightGBM model significantly outperformed the standard Velocity Loss and Baseline Prescribed Reps models. Of particular note is the excellent performance in the Mean Average Error when RIR ≤ 5. It matched expert human estimators with years of experience resistance training. The precision, recall, and f1 columns are based on the binary classification task of correctly identifying when RIR ≤ 5, i.e. identifying effective reps, which it did very effectively. We believe the VL model demonstrated poor accuracy with our users because the main assumption that they are imparting maximum effort during every repetition they perform is almost certainly not true.
Conclusions
As we continue our work to develop accurate, real-time RIR predictions, we’re working to improve Tonal’s ability to:
Identify effective/stimulating reps dynamically during workouts
Better adjust loads or rep targets mid-workout to hit muscle growth zones
Track proximity to failure and fatigue levels across time
Personalize rest and recovery guidance for smarter programming.
This means a richer understanding of user’s effort and the impacts of that effort. This will allow us to track progress and guide our users even more effectively than before.
Over the next months, we’re working to refine this model and move it from research into production. Beyond improving model performance, we’d also like to include more readiness features including off Tonal signals to incorporate into the model. For example, if you’ve done a lot of volume (or effective reps!) recently, had a bad night’s sleep, or are still sore from your last workout, any of these might impact how quickly you hit failure.
Our goal is to build the world’s most accurate RIR model and use it to continue to deepen Tonal’s intelligence and provide richer, more nuanced, and more tailored workouts for our users.
Want to Shape the Future of Strength Training?
We’re blending biomechanics, data science, and intelligent coaching tools to push the frontier of personalized resistance training.
Follow the Tonal Engineering & AI blog to learn how we’re using machine learning, biomechanics, and sensor data to make workouts smarter.
Have any questions or thoughts? We’d love to hear them! Leave a comment or reach out!
References and Additional Reading
3DAHM 2024 Poster PDF – Leveraging Machine Learning to Improve Repetitions in Reserve Estimates
Zourdos et al., 2024 – Exploring dose–response between RIR, strength, and hypertrophy, Sports Medicine
Grgic et al., 2022 – Effects of resistance training performed to repetition failure or non-failure on muscular strength and hypertrophy: A systematic review and meta-analysis, Journal of Sport and Health Science
Wow! This is amazing. I mentioned incorporating health data (sleep efficiency, prior days' workout, etc.) into Tonal's algorithm to more precisely customize Daily Lifts. Can't wait to see the development around incorporating these metrics and RIR to Tonal. Keep up the great work and pushing the limit.